
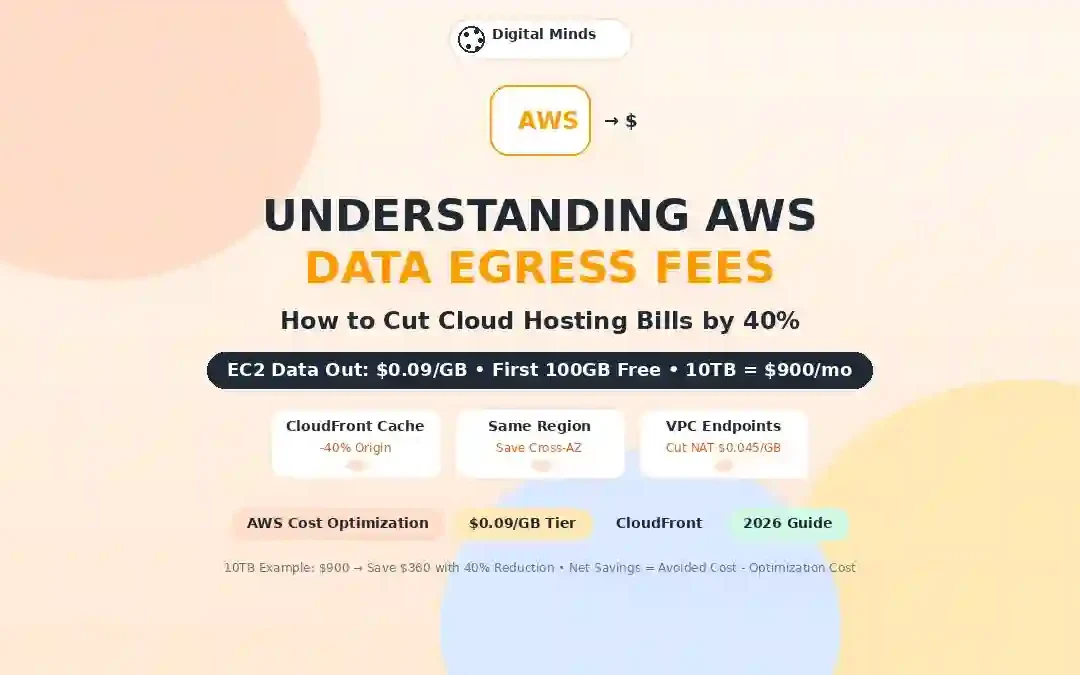
Understanding AWS Data Egress Fees: How to Cut Cloud Hosting Bandwidth Bills by 40%
AWS compute is often not the biggest surprise on a cloud bill. For high-traffic applications, downloads, APIs, media delivery, backups, cross-region replication, and poorly placed services can quietly turn network traffic into a major monthly expense.
This guide explains how AWS data egress fees work, where bandwidth charges actually come from, how to identify expensive traffic paths, and which architecture changes can potentially reduce your network bill by around 40% without simply sacrificing performance.
Quick Answer: How Do You Reduce AWS Data Egress Costs?
The fastest way to reduce AWS bandwidth costs is not usually to reduce traffic itself. Instead, reduce billable bytes leaving expensive AWS paths.
For many workloads, the biggest opportunities are caching static content through Amazon CloudFront, keeping chatty services in the same AWS Region, avoiding unnecessary cross-AZ traffic, using VPC endpoints for supported AWS services, compressing large responses, reducing oversized API payloads, and removing unnecessary replication or backup transfers.
AWS currently lists $0.09/GB for the first 10 TB/month of EC2 data transfer out to the internet, after the shared 100 GB monthly free allowance. Higher tiers can be cheaper per GB. Your actual rate can vary by service, destination, region, and architecture.
A 40% reduction is therefore a practical optimization target for some traffic-heavy environments, not a guaranteed AWS discount.
What Are AWS Data Egress Fees?
Data egress generally means data leaving an AWS service, region, or network boundary. In AWS billing discussions, it is often used interchangeably with data transfer out.
Imagine a SaaS platform hosted in US East (N. Virginia). A customer in London downloads a 200 MB report. Another customer streams a 1 GB video. Your API sends 50 MB of JSON data to a third-party service. Your backup system copies several hundred gigabytes to another region.
None of these activities looks unusual from an application perspective. But from a cloud-cost perspective, they represent network movement that can create additional charges.
Traffic delivered from AWS services toward customers, browsers, apps, or external systems.
Traffic between services, Availability Zones, or AWS Regions can have separate pricing.
NAT Gateways can add per-GB processing charges even when the traffic is not an internet egress charge.
AWS Data Transfer Pricing: What CTOs Need to Know
AWS data transfer pricing is service-specific. There is no single universal “AWS bandwidth price.”
For example, AWS's current EC2 pricing documentation shows a shared monthly allowance of 100 GB of data transfer out to the internet across eligible AWS services and regions, followed by tiered pricing. For EC2 internet data transfer out, the first 10 TB/month is listed at $0.09/GB, with lower rates at higher usage tiers.
| Monthly tier | Published rate | What it means |
|---|---|---|
| First 100 GB | $0.00/GB | Shared monthly internet data transfer allowance for eligible AWS services. |
| First 10 TB | $0.09/GB | Typical published EC2 internet DTO tier. |
| Next 40 TB | $0.085/GB | Lower rate at higher aggregate usage. |
| Next 100 TB | $0.07/GB | Lower tier for very large transfer volumes. |
| Above 150 TB | $0.05/GB | Large-volume internet DTO tier. |
Rates shown are AWS-published examples for EC2 internet data transfer out and are not a universal price for every AWS service, destination, region, or contract. Taxes and other service charges can also apply.
AWS also aggregates certain data-transfer-out usage across eligible services when calculating internet DTO tiers. That makes it important to look at the complete account rather than treating one EC2 instance as an isolated cost center.
Before making an architecture decision, verify the current pricing for the exact AWS service and region involved.
A Real-World AWS Egress Bill Example
Consider a SaaS company serving customers across the United States and Europe. Suppose its application generates approximately 10 TB of outbound internet traffic each month.
At a simplified $0.09/GB rate, 10 TB of billable traffic would represent roughly $900 in data-transfer charges before considering the shared free allowance, different service rates, taxes, or other AWS charges.
Now suppose architectural improvements reduce origin traffic by 40%.
4,000 GB × $0.09/GB = $360/month potential gross DTO reduction
The resulting bill would not necessarily fall by exactly $360 because the replacement architecture may introduce CloudFront, request, storage, logging, or other charges. The correct calculation is always:
Use Amazon CloudFront to Reduce Origin Traffic
For applications serving cacheable content, Amazon CloudFront is one of the most important AWS tools to evaluate.
Instead of every visitor retrieving a file directly from your EC2, S3, or load-balancer origin, CloudFront can serve cached content from locations closer to users.
User → Internet → EC2/ALB → Origin serves every static request
User → CloudFront edge → Cache hit → Origin is bypassed
Fewer origin requests, lower origin bandwidth, and potentially lower compute/database load.
AWS states that data transfer between CloudFront and AWS origins such as S3, Application Load Balancer, and API Gateway can be waived under applicable CloudFront pricing structures. CloudFront also reduces origin requests by serving cached content at edge locations.
AWS's current CloudFront documentation also describes Origin Shield as an additional caching layer that can reduce origin load. Origin Shield can be placed in a region close to the origin.
Review current Amazon CloudFront pricing .
CloudFront Is Not Automatically Cheaper
This is an important distinction.
CloudFront introduces its own pricing dimensions, including data transfer and requests. If almost all of your traffic is dynamic and uncacheable, the savings may be much smaller.
Measure your cache-hit ratio before assuming that adding a CDN will cut the AWS bill.
Keep Chatty AWS Services in the Same Region
One of the simplest network-cost principles is also one of the easiest to overlook: services that communicate constantly should generally be close together.
Imagine this architecture:
Every arrow deserves investigation.
Multi-region architecture can be exactly the right decision for global applications. But it should be intentional. Do not distribute services across US East, US West, London, and Frankfurt simply because those regions exist.
A Better Starting Point
Consider a primary US region such as US East (N. Virginia) when it fits your users and architecture.
Consider a European region such as London or Frankfurt when latency, residency, or business requirements call for it.
Separate user-facing delivery from stateful backend traffic and measure cross-region data movement.
CloudFront can provide a global delivery layer without requiring every backend service to exist in every region.
For teams considering a broader infrastructure redesign, our guide to shared vs VPS vs cloud hosting provides useful context on how hosting models differ operationally.
Fix NAT Gateway Data Processing Costs
NAT Gateway can become an unexpected line item in a growing AWS environment.
AWS currently documents NAT Gateway billing as a combination of availability-hour charges and per-GB data processing. AWS also recommends using interface or gateway VPC endpoints for supported AWS services when appropriate because this can reduce NAT data processing.
A common pattern looks like this:
If the destination is an AWS service that supports an appropriate VPC endpoint, consider:
This can reduce the amount of traffic processed by the NAT Gateway.
The same principle applies to architecture reviews: if a private application server is making millions of calls to an AWS-native service, inspect whether that traffic really needs to traverse NAT.
Shrink API and Web Payloads Before Buying More Infrastructure
Engineers sometimes try to solve bandwidth costs by changing hosting plans. That can miss the underlying problem.
If the application sends unnecessary data, the most effective optimization may be inside the application itself.
High-impact payload optimizations
- Enable Brotli or gzip compression where appropriate.
- Resize images before delivery instead of sending original camera-sized files.
- Use modern image formats when browser support and workflow permit.
- Paginate large API responses.
- Return only fields the client needs.
- Compress large JSON responses.
- Remove duplicate API requests.
- Cache public API responses where business logic allows it.
- Use long-lived caching for versioned static assets.
- Prevent automated crawlers from repeatedly downloading unnecessarily large resources.
US vs EU AWS Regions: Does Geography Affect Your Bill?
Yes. Region selection can influence data transfer pricing, latency, compliance requirements, and the architecture required to serve customers efficiently.
A US-focused startup might have its primary workload in US East (N. Virginia), while a European SaaS business could consider London or Frankfurt. A global business may use a primary region plus CloudFront for worldwide content delivery.
| Strategy | Potential advantage | Potential cost risk | When to investigate |
|---|---|---|---|
| Single US Region | Simple architecture and fewer cross-region transfers | Higher latency for distant users | US-focused SaaS or web applications |
| Single EU Region | Closer backend for European customers | US traffic may travel farther to origin | EU-focused products |
| US + EU Active/Active | Lower user latency and regional resilience | Replication and synchronization traffic | Large global SaaS platforms |
| Single Origin + CloudFront | Global edge delivery without duplicating every backend service | CloudFront and request charges; dynamic traffic still reaches origin | Content-heavy global applications |
AWS currently lists Origin Shield availability in regions including US East (N. Virginia), US West (Oregon), Frankfurt, London, and others. For an origin hosted in a supported AWS region, AWS recommends selecting the Origin Shield region that matches the origin region.
AWS Egress Architecture Comparison
The following table compares common traffic patterns rather than ranking products. The purpose is to show where bandwidth charges can originate.
| Architecture | Origin traffic | Network-cost exposure | Operational complexity | Best suited to |
|---|---|---|---|---|
| Direct EC2 → Internet | High | Internet DTO | Low | Small or simple applications |
| EC2 → CloudFront → Users | Lower for cacheable content | CloudFront + origin traffic | Medium | Content-heavy applications |
| S3 → CloudFront → Users | Low for cacheable objects | CloudFront delivery and requests | Low–Medium | Downloads, media, static assets |
| Private EC2 → NAT → AWS service | Not necessarily high internet egress | NAT hourly + per-GB processing | Medium | Private workloads requiring outbound access |
| Private EC2 → VPC Endpoint → AWS service | Can avoid unnecessary NAT path | Endpoint-specific pricing | Medium | High-volume AWS service access |
| Multi-region application | Varies | Inter-region transfer + replication | High | Global or resilience-sensitive platforms |
AWS itself notes that data transfer charges vary according to service and source region, which is why architecture-level billing analysis is more useful than applying one “bandwidth price” to the entire AWS account.
How to Build a 40% AWS Egress Reduction Plan
If your goal is to reduce network costs by 40%, do not begin by changing instance sizes. Start with traffic visibility.
- Find the largest data-transfer line items. Use AWS billing and Cost Explorer data to identify services, regions, and usage types associated with data transfer.
- Separate internet traffic from internal traffic. Determine how much traffic goes to customers versus other AWS services, Availability Zones, Regions, NAT Gateways, or third parties.
- Calculate your cacheable percentage. Identify static files, downloads, images, video, packages, and other objects that could be delivered from CloudFront rather than the origin.
- Review NAT Gateway paths. Look for high-volume traffic to AWS services that could use appropriate VPC endpoints.
- Audit cross-AZ communication. Look for databases, caches, queues, services, and load-balancing patterns that generate unnecessary cross-zone traffic.
- Audit cross-region replication. Measure whether every replicated dataset is actually required at its current frequency.
- Compress application responses. Reduce the number of bytes transferred per request before increasing infrastructure.
- Measure the new architecture. Compare cost per GB, cost per user, cost per API call, and total monthly network spend.
How AWS Egress Optimization Applies to WordPress and WooCommerce
WordPress sites can generate surprising bandwidth bills when images, CSS, JavaScript, product assets, downloads, and uncached pages are served repeatedly from the origin.
WooCommerce adds another challenge: many pages and requests are dynamic, so you cannot simply cache everything.
For WordPress
- Put cacheable images and static assets behind a CDN.
- Use responsive image sizes rather than delivering oversized originals.
- Compress CSS and JavaScript.
- Use long cache lifetimes for versioned assets.
- Prevent unnecessary plugin-generated requests.
- Review bot and crawler traffic.
If you are comparing hosting architectures before moving to AWS, see our guide on managed cloud hosting for US small businesses .
For WooCommerce
Treat cart, checkout, account pages, payment flows, and personalized sessions differently from public product assets.
Public product images can often benefit from aggressive edge caching. Checkout requests generally require much more careful cache rules.
Our comparison of WooCommerce hosting performance in US East provides additional context on why network architecture and application performance should be considered together.
If a high-traffic WordPress migration is part of the project, our guide to migrating high-traffic WordPress to DigitalOcean covers the broader infrastructure side of the move.
8 Common AWS Egress Optimization Mistakes
1. Assuming all bandwidth costs the same
It does not. Service, region, direction, and architecture matter.
2. Adding a CDN without measuring cache hits
A CDN is not magic. Poor caching can leave origin traffic almost unchanged.
3. Ignoring NAT Gateway processing
A team can reduce internet DTO and still discover a large NAT data-processing bill.
4. Moving everything into multiple regions
Multi-region architecture can improve resilience and user experience, but it can also introduce replication and inter-region transfer costs.
5. Sending oversized API responses
Application payload design is part of cloud cost management.
6. Optimizing bandwidth while increasing compute costs
Compression, image processing, edge functions, and transformation pipelines consume resources. Always calculate the net result.
7. Ignoring third-party traffic
Analytics, monitoring, external APIs, payment systems, data warehouses, and backup platforms can create network traffic that is easy to miss in a basic website bandwidth report.
8. Treating the AWS bill as a monthly surprise
Set budgets, alerts, and recurring reviews before traffic grows. Cost optimization is much easier when you can identify a trend before it becomes a five-figure invoice.
AWS Bandwidth Cost Audit Checklist
Use this checklist during your next infrastructure review:
- Identify total monthly data transfer out.
- Identify the AWS services generating the most transfer.
- Separate internet, inter-region, cross-AZ, and NAT traffic.
- Review the top AWS billing usage types.
- Calculate CloudFront cache-hit ratio.
- Move suitable static content behind CloudFront.
- Review CloudFront TTL and cache-key configuration.
- Check whether Origin Shield is appropriate.
- Review NAT Gateway data processing.
- Evaluate VPC endpoints for high-volume AWS service traffic.
- Measure cross-AZ application/database traffic.
- Measure cross-region replication.
- Compress large API and web responses.
- Optimize images and downloadable files.
- Review backup and log transfer paths.
- Compare cost before and after each architecture change.
Want a simpler hosting architecture?
AWS can be an excellent platform, but not every business needs to manage every layer itself. Managed cloud and managed WordPress platforms can reduce operational overhead when the workload does not justify a large infrastructure team.
Explore our guide to managed WordPress hosting for agencies or our comparison of Cloudways vs Hostinger cloud performance .
For Agencies and Resellers
Agencies managing multiple client websites should also consider whether every workload needs its own cloud architecture. Network efficiency, support overhead, monitoring, backups, and client isolation can all affect the true cost of a hosting platform.
Our guide to white-label reseller hosting platforms explores that alternative model.
Frequently Asked Questions About AWS Data Egress Fees
What are AWS data egress fees?
AWS data egress fees generally refer to charges associated with transferring data out of AWS services, regions, or network paths. The exact price depends on the service, destination, region, traffic direction, and applicable pricing tier.
How much does AWS charge for data transfer out?
AWS pricing varies by service. For EC2 internet data transfer out, AWS currently lists $0.09/GB for the first 10 TB/month after the shared 100 GB monthly free allowance, with lower rates at higher usage tiers. Always verify the current rate for your exact service and region.
Can CloudFront reduce AWS egress costs?
It can. CloudFront can cache suitable content at edge locations, reducing the number of requests and bytes that reach the origin. However, CloudFront has its own pricing, so the correct calculation is based on net savings rather than origin bandwidth alone.
Does AWS charge for data transfer between Availability Zones?
AWS generally charges for applicable cross-AZ data transfer. The exact pricing depends on the services and traffic path involved. High-volume cross-AZ communication should therefore be part of a cloud cost review.
How can I reduce NAT Gateway costs?
Start by identifying which workloads send large amounts of data through NAT Gateway. For supported AWS services, appropriate VPC endpoints can reduce traffic that would otherwise be processed by NAT Gateway. Also review whether the NAT architecture is aligned with your Availability Zone design.
Is 40% AWS bandwidth savings realistic?
It can be realistic for some inefficient, traffic-heavy environments, especially when there is substantial cacheable content, unnecessary NAT processing, oversized payloads, or avoidable cross-region and cross-AZ traffic. It is not a universal or guaranteed reduction.
Does moving an AWS workload to another region always reduce costs?
No. Region selection affects more than compute pricing. Data transfer, latency, availability, compliance, service availability, replication, and user geography all matter. Model the complete architecture before moving workloads.
How do I find the biggest source of AWS bandwidth costs?
Start with AWS billing and Cost Explorer data, then inspect data-transfer usage types, source services, destinations, regions, and traffic paths. For large environments, combine billing analysis with application, VPC, CloudFront, and observability metrics.
Final Takeaway: Optimize the Path, Not Just the Server
AWS data egress costs become much easier to manage when you stop thinking of bandwidth as a single line item and start treating it as a property of your architecture.
A website sending 10 TB of data from an EC2 origin to customers has a very different cost structure from a website delivering the same content through a well-configured CDN. Likewise, a private application sending large volumes through NAT Gateway can have a very different bill from one using appropriate VPC endpoints.
For most CTOs and technical leads, the practical sequence is straightforward:
Find exactly where the bytes are going.
Cache, compress, consolidate, and remove unnecessary network paths.
Measure net AWS cost, performance, reliability, and operational impact.
A 40% reduction is possible for some workloads, but the strongest cloud cost strategy is not chasing a headline percentage. It is building an architecture where every gigabyte has a clear reason to move.
Editorial note: AWS pricing and service configurations change over time. The examples in this article are intended for planning and education. Check the current AWS pricing documentation and your account-specific pricing before making production architecture or budget decisions.
Trackbacks/Pingbacks